Trading forex like a pro is not a day job. It requires you to get acquainted with basic facts, industry tools and trading terminologies. It also requires that to have a sharp eye on the price trends. One of the analytical tools used to study the price trend is the moving average, which shows a regularly updated average price, taken over the period of time that the broker chooses – the time period can be in days or weeks, or even hours. This article reviews the types of moving averages, factors to consider and other tips that will help you understand how to use moving averages to trade like a pro.
Types of Moving Averages
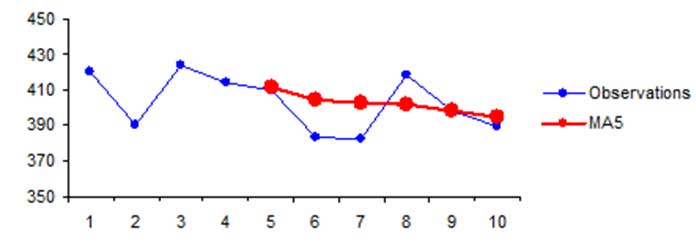
There are different ways in which a moving average can be calculated. The first type of moving average is the simple moving average (SMA), which takes the prices over a 5-day period to calculate the average. The SMA is revised each day creating a single flowing line.

The other type of moving average is the exponential moving average (EMA) which is a bit more complex. It places more weight on the most recent prices. When comparing both the types of moving average, you’ll see that that the EMA is more reactive to price changes due to the difference of placing additional weights on recent prices.

The third type of moving average, closely resembling the EMA, is the linear weighted moving average (LWMA), also referred to as simply the weighted moving average at times. It places proportionate weight on the most recent values throughout the data series while on the other hand EMA only places a higher weight on the most recent value.

Any charting platform provides the option of calculating all types of moving average. It can be applied to either the opening price or the closing price or the high or low prices of a time series. Most often, the moving average is applied to the closing price as it is the level where the price has settled and becomes the opening price for the following day.
Benefits of Moving Averages
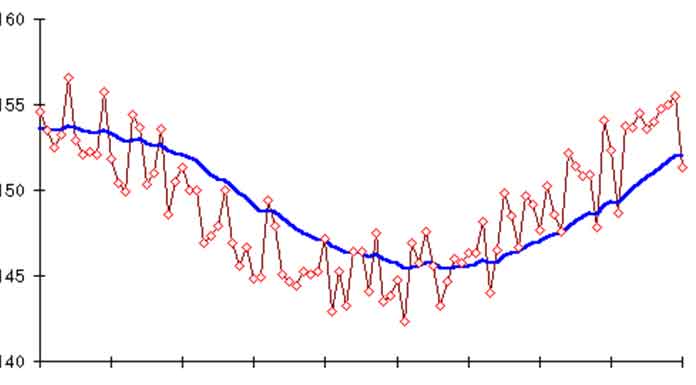
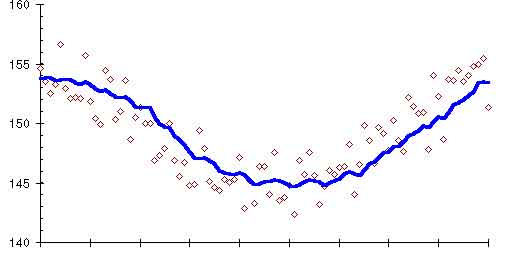
There are many benefits to using moving averages to investors, and the prime benefit is that it provides a fair idea on the way the prices are moving – a reasonable measure of the trend. If the moving average chart is angled upwards, it indicates that overall the price has risen, and if it angles down, it means that the overall prices have dropped. A sideways move is indicating that more or fewer prices have remained the same.
Another benefit that it provides is acting as “support” or “resistance”. This means that in an uptrend, the average acts like a floor, the price bounces up off it. In a downtrend, it acts as resistance, the ceiling where price hits and drops again.
Factors to Consider
Here, we list down some essential factors that you should consider when choosing the right method to use to calculate moving averages.
The Type of Data Used
As mentioned earlier, the moving average can be based on the open, close, high low or median price. Generally, it is based on the closing price, but this is certainly not set in stone. You can base it on any value that you prefer, but keep in mind that your decision will be reflected in minor changes when you plot the moving average on a chart; these minor changes, however, are also very important when it comes to analyzing the price trend more accurately.
Length of Moving Average
A moving average is not only calculated for a certain number of days but can be for any time period – it could be minutes, hours, weeks, months, or even an entire quarter. The time frame is also called the “look-back period” and directly impacts the effectiveness of the average. As compared to a long look back period, a shorter one will quickly react to price changes.
Moving Averages Trading Strategies
While a moving average is an important analytical tool, different traders use it differently. Some use it as a confidence builder while others it as their primary analytical tool. Following are some common strategies used in moving averages:
Crossover
A major and very common moving average strategy is the crossover. The first type of crossover is the price crossover, used by traders as an entry or exit strategy as it identifies shifts in prices. A potential change in trend is indicated when a price crosses above or below the moving average.
The second type of crossover is the golden cross, where a short-term average and a long-term average are plotted on the same chart. The crossover of the short-term average above the long-term average indicates a buy signal and vice versa as it reflects an upward trend. The crossover of the short term average below the long-term average is called a dead/death cross, indicating a downward trend, and a signal to sell.
Moving Average Envelope
Another strategy in moving averages is that of the envelope. This strategy plots two bands set at a specific percentage rate around the average. These bands act as areas of support or resistance for the trader. If the price goes beyond the band, it signals exhaustion and the trader will typically wait for it to revert to the centre average again.
Triple Crossover
Many traders place 5-, 10- or 20-day moving averages to a chart to increase the reliability of the signal. They wait until the five-day average crosses over the other averages, signalling a buy. A tactic often used that reduces the number of false signals is to wait until the 10-day average crosses above the 20-day average. Using the triple crossover method, you can increase the number of moving averages to gauge the strength and likelihood of the continued of a trend.
Filter
Filter is a technique used to increase the confidence of the trader when engaging in a certain trade. It is used in any technical analysis and allows the investor to gauge the validity of the crossover. It also helps reduce the number of false signals, but relying on a filter is likely to create negative feeling if you end up losing too much of the gain. Filtering has no set rules.
How to Use Moving Averages
One way to use moving averages to trade like a pro is to use them as momentum indicators. See if it shows a trend and its strength. A consistent and strong angle in an upward direction is an indication that a trend exists.
A more sophisticated way to use the momentum indicators is to implement a faster-moving average and a slower moving average on multiple frames and look for a point when the former is above the latter. If the higher time frames indicate a good trend compared to the trend on lower time frames, you can enter in the direction of the trend when it crosses back in the direction of the higher time frames.
Some Drawbacks of Using Moving Averages
Moving averages are essentially an analytical tool that uses historic data to show price trend. Its calculations are not predictive and can sometimes be random. A major problem with moving averages is that if the price is fluctuating, it may generate multiple signals and trends. It’s best for traders to use another tool in conjunction with this to gauge the right trend when this happens. In strong conditions, the moving average may work quite well, but in price fluctuating conditions or works very poorly.
End Note
The moving average creates one flowing line and helps smooth out the price, which makes it easier for investors to isolate a trend. It is important to differentiate between the two basic types of moving averages, the simple moving average, and the exponential moving average because neither one is preferred over the other. In some cases, the EMA may give a false signal, although it reacts quicker to price changes.
Another important thing to remember when choosing the length of the moving average is that shorter look-back periods will be quicker to indicate and respond to price changes than longer look back periods. For example, a 20-day period against a 200-day period will respond more quickly to a price change.
Using any moving average strategy should be based on your decision of the viability of this tool. Like mentioned earlier, some traders may use it as a primary tool while others may not. It’s up to you to use it any way that you want, but it’s important to know when it might not be indicating the price trends accurately in accordance with real market changes.
As an investor, you must be careful to the extent to which you rely on moving averages and use other tools as well along with it to recognize certain trends which may be a false alarm.
